Geographic platforms
Esri ArcGIS
Commercial platform · Government, Corporate, Research
Maps, spatial analysis and geographic data for city and infrastructure applications.
Used as the geographic foundation of larger twin applications. [32]
Cities, infrastructure, populations and ecosystems
Advances in computation, geographic data and AI are expanding what we can simulate—and who can use the results. Transport planners can test road closures. Utilities can examine how electric vehicles and heat pumps will change demand. Fire agencies can estimate where a wildfire will spread. Communities can explore competing proposals for the places they live.
The digital-twin industry is growing around these applications: models of real places and systems, supplied with data from the world they represent. This survey asks who uses them, which engines and platforms underpin them, what they can do today, and how far they have progressed toward whole systems modeling. A further frontier is coming into view: using models to discover ways of living and producing within ecological systems whose interactions exceed our unaided ability to reason about them.

A digital twin is a computational representation of a real object, place or system, linked to information about its real-world counterpart. The connection allows the model to be updated as conditions change and used to explore what might happen next—or what would happen if something were changed. The update interval depends on the application: traffic signals and long-term housing plans operate on different clocks. [1]
A traffic twin, for example, combines a road network with traffic counts, signal timings and vehicle movements. It can help an operator respond to congestion or let a planner experiment with a different junction layout. Tees Valley's traffic twin, developed with Aimsun, is already used at its traffic management centre to identify delayed buses and support changes to signal operation. [2] [3]
The wider simulation field includes the design of individual machines and operator training—for example, learning to control a tree harvester safely. The focus here is large-scale systems with public consequences: cities and regions, electricity and water networks, transport and crowds, watersheds and ecosystems. Their users include corporations, governments and citizens, often with different interests in the same place.
There are several names for this part of the field. Urban and territorial digital twins describe models organized around places. Infrastructure twins describe networks and assets. Cyber-physical-social systems explicitly include people and their behavior. Multiscale describes models that connect levels of detail, such as individual households and a regional electricity grid. These terms overlap; the survey uses the plain description “large-scale digital twins” rather than treating any one of them as a universal category. [4] [5]
Cities & places Movement & logistics
 Energy
 Water
 Food & land
 Living systems
 Weather & climate
 People & society
 Fire
 Sensory landscape
| Use | A concrete question | Systems and examples |
|---|---|---|
| Traffic and public transport | Where will vehicles go after a closure, and can signal changes help a late bus? | Aimsun; Tees Valley's operational traffic twin; SUMO and MATSim modeling engines. [2] [6] [7] [3] |
| Crowds and evacuation | How will people move through a station or leave an area during an emergency? | AnyLogic pedestrian models; GAMA evacuation models. [8] [9] |
| Electricity and energy transitions | Where will electrification require more network capacity, storage or generation? | Neara; PyPSA; the UK NDTP's Isle of Wight energy demonstrator. [10] [11] [12] |
| Flooding, rivers and water services | Which areas will flood, and how will changes to rivers, drainage or pumps affect them? | Deltares Delft3D; DHI; Xylem Vue. [13] [14] [15] |
| Wildfire and exposure | Where might a fire spread, which assets are exposed, and where would mitigation help? | Technosylva's operational and planning tools for utilities and fire agencies. [16] |
| Housing and land use | How might zoning or transport investment change development and household location? | UrbanSim; Urbanly CityCompass. [17] [18] [19] |
| Ecosystems and land management | How might land-use changes affect water, habitat, carbon or agricultural production? | InVEST, DSSAT and GCAM supply models for these questions; Earth Index helps map environmental features. [20] [21] [22] [23] |
| Weather and climate | What conditions are likely next week, and how might a region's climate change over decades? | WeatherNext, NVIDIA Earth-2 and Destination Earth. [24] [25] [26] |
| Sensory landscape | How do sound, light, smell and barriers affect people and other animals? Could a different street, crossing or lighting scheme make a place easier to inhabit? | Walk Score for walkability; CadnaA for noise; Radiance for light; GRAL for odor dispersion; Circuitscape for habitat connectivity. Components of a possible coupled model. Appendix G. |
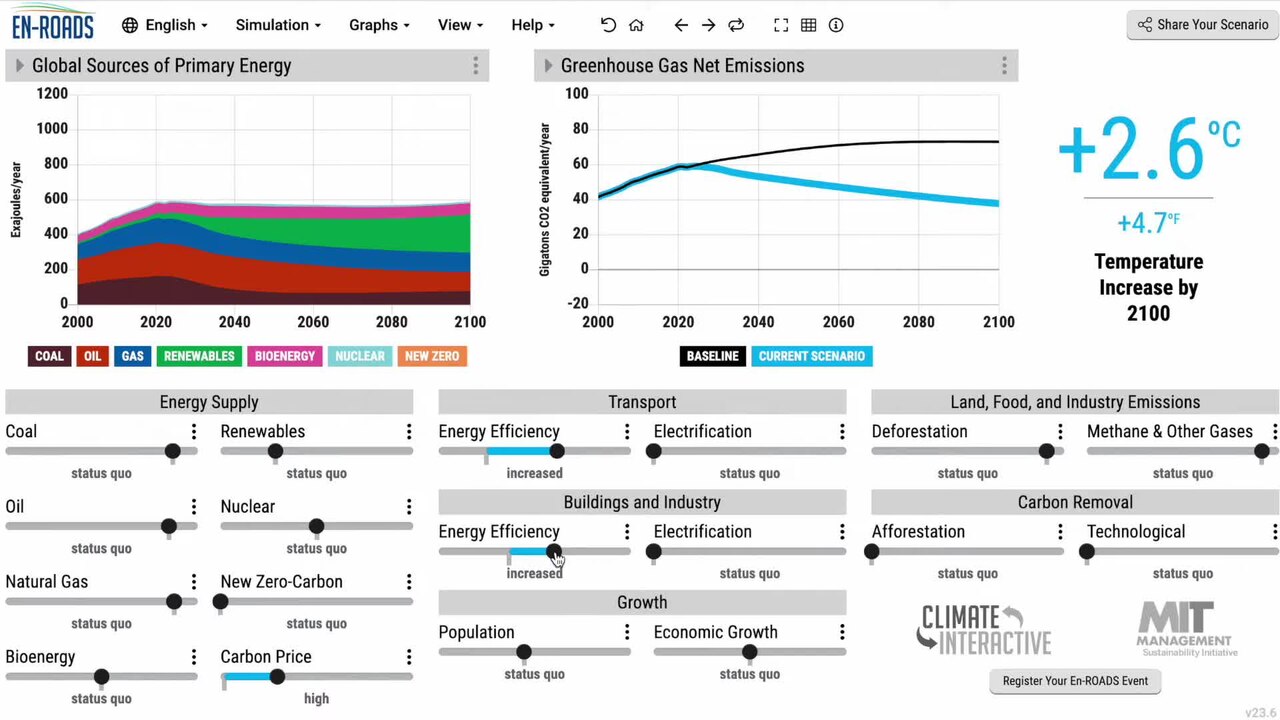
| Public discussion and learning | What changes when we combine different climate policies or land-use proposals? | En-ROADS; Geodesignhub; public city-model and planning interfaces. [27] [28] [29] |
This includes both operating twins and the simulation engines or data services used to build them. A general crop model, a traffic engine and a maintained twin of a particular region are different products, but all belong in an account of how these systems are assembled.
The audiences are visible in the applications. A utility wants to keep service running and choose investments. A local authority wants to compare transport, housing and environmental proposals. Residents may want to inspect a proposed road, explore an alternative, or understand which neighborhoods benefit. The same underlying model can support all three, provided each has an interface suited to its task.

The software market divides into geographic platforms, simulation engines and applications built for particular domains.
Esri and Bentley are central reference points for the geographic and infrastructure layer. ArcGIS organizes maps, spatial analysis and related data; Bentley iTwin integrates engineering and infrastructure information. Dassault Systèmes supplied the platform used for Virtual Singapore. These systems can give different teams a common representation of a place, its buildings and its assets. [30] [31] [32]
Simulation engines supply the behavior. AnyLogic supports agent-based, discrete-event and system-dynamics models. GAMA combines spatial data and agent-based modeling. MATSim models the travel choices and movements of many agents across transport networks; SUMO simulates vehicles, public transport and pedestrians. PyPSA provides power and energy-system modeling. Deltares and DHI supply water-modeling tools. A city project may use several of these engines. [14] [8] [9] [6] [7] [12] [15]
Specialist platforms package models around a job. Aimsun serves transport planners and traffic operators. Neara serves electricity networks. Urbanly and UrbanSim address development and land use. Technosylva combines fire-spread modeling, weather and asset information for wildfire operations and mitigation. These are often the products a buyer encounters before encountering the underlying mathematics. [10] [2] [17] [19] [16]
“Which engine?” is therefore partly a question about the model: roads, electrical networks and household decisions behave differently. The larger platform choice also concerns the data, interfaces and integrations a project needs. Appendix A separates those roles and lists representative systems.
Weather forecasting provides a concrete example. WeatherNext 3 uses satellite observations and training on weather-station measurements to produce hourly forecast updates, reaching five-kilometer resolution for selected variables. Results are distributed through data services and Google's products. That combination makes a computationally demanding model available to people who will never run the model themselves. [24] [33]
Earth Genome reduces a different barrier. Its Earth Index application lets a user label examples of a feature in satellite imagery, search for similar locations, inspect the results and export a map. Applications include locating mining activity and livestock facilities. In a September 2026 study, the team combined SSL4EO and AlphaEarth representations to improve cattle-facility detection. Reusable geospatial models are becoming ingredients in practical environmental investigations. [20] [34] [35]

Urbanly adds a conversational interface to urban simulation: the assistant helps set up and run experiments, while the simulation engine produces the numerical results. This changes how a planner can work with a model. It does not require the planner to build each experiment through code or a specialist modeling interface. [36]
These developments affect different costs: producing forecasts, extracting information from imagery, and setting up experiments. Together they make richer models available through ordinary data services and browser tools. Local data preparation and model calibration still account for work that a new interface cannot automatically eliminate.
There are already models that connect several domains. They differ in what they connect and how much detail they retain.
GCAM connects energy, water, agriculture and land, the economy, and climate. It can examine, for example, how a change in energy policy alters land and water demand. Developed over decades, it represents a substantial whole systems tradition that predates current digital-twin branding. Its purpose is to explore regional and global scenarios, rather than reproduce every building or household. [21]
PyPSA-Eur connects electricity to transport, buildings and industry. It can examine how an energy transition changes generation, networks, storage and demand across sectors. It is an open energy-system model, not a live operational twin of every connected asset. [37]

Urban models connect people and development. UrbanSim represents location choice and urban growth, with connections to transport modeling. Urbanly publishes comparisons between simulated and recorded housing development in parts of Los Angeles and New York. These models can address interactions that a geometric city model alone cannot: where households locate, what gets built, and how development responds to the modeled rules. [17] [18]
Connected infrastructure models address cascading failures. CReDO examines climate hazards and dependencies between networks. A flooded electricity asset can affect water pumping or communications, so the consequence extends beyond the damaged asset. Its September 2026 MVP showcase presents this approach to resilience planning; a final platform release is planned for 2028. [38] [39]
Whole systems modeling therefore exists in several forms: integrated models, linked domain models, and applications combining common data with specialist simulations. A comprehensive, routinely updated model of a city's physical, ecological, economic and social behavior remains a much larger undertaking. The examples above solve portions of that problem at different scales.
Virtual Singapore made the national-scale ambition visible: a shared 3D representation containing information about buildings, terrain and the city around them. GovTech's description illustrated uses such as assessing rooftop solar potential, flooding, wind and urban heat. Singapore's current geospatial programs continue to support applications including flood-risk assessment and solar-energy analysis. [40] [41]
The UK National Digital Twin Programme takes a broader infrastructure approach. Its published Isle of Wight demonstrators include electricity, housing retrofit and emergency planning. The energy demonstrator links network questions to electrification and renewable generation. The housing example brings together building characteristics, eligibility for retrofit funding and household vulnerability. Those examples show why social and policy information belongs alongside physical infrastructure. [11] [42] [43] [44]
These programs also expose the institutional scale of the task. A city's roads, electricity, water, land records and housing data are maintained by different organizations. Connecting their models requires agreements about sharing and updating that information, as well as software. DAFNI supplies research infrastructure for collaborative modeling; work such as Wenwen Li's at ASU addresses the discovery and integration of distributed geospatial data. [45] [46]
Access already takes several forms. Helsinki publishes city-model data and a browser-based energy atlas. En-ROADS makes climate-policy scenarios available for public learning. Geodesignhub gives stakeholders a shared setting for developing and comparing spatial proposals. Earth Index puts environmental mapping tools in the hands of investigators. [20] [27] [28] [29]
A public planning interface could let someone move a proposed cycle route, compare traffic changes, and share the alternative with a council. Delivering that experience requires more than exposing an expert application's controls: the scenario must load quickly, the choices must be understandable, and the results must identify what changed. Whether residents can simply view a model or actually propose alternatives is an important product distinction.
The full stack runs from satellite imagery, sensors and administrative records through geographic data, simulation engines and linked models to the interface where somebody uses the result. A working application also needs a team to maintain those connections as roads, assets, populations and data sources change.
The industry has established suppliers for geography, transport, water and energy, alongside newer companies building environmental search, urban simulation and AI interfaces. Reusable connections between these tools would let more cities and watersheds draw on this accumulated modeling work.
The applications above often start with systems we have made explicit: a road network, an electricity grid, a zoning code, and a known set of controls. A more consequential frontier concerns systems whose organization is largely implicit. Climate, soils, water, organisms and human activity influence one another through relationships that we have only partly observed or formalized. Timothy Morton's term hyperobjects captures a related difficulty: phenomena distributed across so much space and time that we cannot encounter them as a comprehensible whole. [47]
Working with these systems means discovering more of their structure as we go. A useful model could help reveal a relationship we had overlooked, suggest an intervention we would not have considered, and identify an observation that would tell us whether it works. This extends the purpose of a twin from operating a system whose controls we understand to exploring possibilities within a system we are still learning to describe.
Agriculture makes the opportunity tangible. Uniform crops, standardized inputs and repeatable operations make production easier to organize. Machinery, labor, markets and policy all help explain that pattern. There is also a cost to managing ecological complexity: the best crop mixture for one soil, season and water regime may perform differently in another. Diversified farming already has a substantial history and evidence base. A 2020 synthesis found that diversification improved several ecosystem services and biodiversity without an average crop-yield penalty, although outcomes varied. Machine learning could extend farmers' and ecologists' ability to work with that diversity. [48]
Imagine planning a productive watershed as a changing mosaic of crops, grazing, trees, wetlands and habitat. A model could search combinations of planting, rotation, irrigation and restoration that would be impractical to compare by hand. The question becomes: which arrangements sustain food production and livelihoods while improving soil, water and biodiversity? This is a search through a fitness landscape with several objectives, delayed effects and changing conditions. There may be many useful sweet spots, and a gain in one outcome can come at another's expense.
In his essay Natural General Intelligence, Ryan Orbuch proposes a nature model that learns environmental state and dynamics across connected Earth systems, anticipates responses to intervention and helps decide what to measure next. It is a written proposal for a direction of research. The compelling idea is that greater intelligence could reveal opportunities to improve living systems that we have not yet recognized—or even known how to ask about. [49]
Fei-Fei Li's World Labs approaches world modeling through spatial intelligence. Its September 2026 Atlas announcement demonstrates scene reconstruction, generation and workflows for robotics simulation. AMD's agreement to acquire World Labs for approximately US$8.2 billion, reported by The Standard and confirmed in AMD's filing, shows the scale of investment entering this adjacent field. These developments suggest more of a model's structure can be learned from observations. Extending that capability to ecological responses over seasons and decades remains an open research challenge. [50] [51] [52]
Human intuition and machine reasoning would have complementary roles. Farmers, scientists and communities contribute experience, goals and constraints. Models propose combinations, estimate their consequences and identify where uncertainty changes the decision. Field trials and continued observation reveal which predictions survive contact with a particular place. The result could be a growing capacity to act intelligently within systems that remain too complex for any one person to understand in full. Appendix F follows this loop through the stack.
The goal is to leave a landscape with greater capacity to support life: healthier soils, more habitat, cleaner water and durable livelihoods. Carbon-negative activity belongs in that ambition, with emissions and removals considered across the whole activity rather than only within a field boundary. Living systems already regenerate many of the conditions on which production depends. Whole systems models could help us strengthen that regenerative capacity—and make its improvement an explicit measure of success.
The table distinguishes software used to build models from applications and public programs. The examples are grouped by function, not ranked by adoption or market share.
Maps, spatial analysis and geographic data for city and infrastructure applications.
Used as the geographic foundation of larger twin applications. [32]
Integrates infrastructure engineering, geographic, reality and sensor data.
iTwin.js provides an open SDK for building applications. [30]
A shared 3D city representation with associated data and simulation applications.
Virtual Singapore is a prominent application of Dassault’s city platform. [31] [41]
Agent-based, discrete-event and system-dynamics modeling; pedestrian and transport libraries.
Custom models for operations, movement and human behavior. [8]
Spatial agent-based models for urban mobility, evacuation, environmental and other applications.
Model construction and experimentation using geographic data. [9]
Large-scale agent-based transport modeling, including travel demand and replanning.
A toolkit for building regional transport scenarios. [6]
Simulates road vehicles, public transport and pedestrians on large networks.
Supports detailed traffic and multimodal scenarios. [7]
Transport simulation and operational traffic prediction.
Aimsun Live supports Tees Valley’s traffic digital twin. [2] [3]
Modeled travel activity and scenario tools for transport and regional planning.
Supplies activity patterns and analysis through a web application and data products. [53]
Models electricity-network geometry and physical behavior using asset and spatial data.
Supports network planning, risk assessment and operational decisions. [10]
Models power systems and energy transitions; PyPSA-Eur also represents transport, buildings and industry.
Used for scenarios and optimization across energy sectors. [12] [37]
Building and district energy modeling, performance analysis and retrofit scenarios.
Connects building data with energy and decarbonization workflows. [54]
Models coastal, estuarine and river systems, including water flow and related processes.
Domain engines for water and environmental applications. [15]
Combines water-system modeling with operational data, including wastewater treatment twins.
CityFlow Live Treatment Plant was previously called TwinPlant. [14]
Combines utility data and water-system modeling for network operations.
Brabant Water describes its use in developing a distribution-network twin. [13]
Models wildfire behavior and exposure for fire agencies and electric utilities.
Combines fire science, weather, terrain and asset information. [16]
Analyzes climate exposure, vulnerability and investment choices.
Decision applications drawing on hazard and geographic information. [55] [56]
Models location choice, development and urban growth, with transport-model integration.
A research-derived engine for regional land-use scenarios. [17]
Explores linked urban scenarios using a simulation engine and browser interfaces.
Published housing backcasts and an assistant for setting up experiments. [18] [36] [19]
VU.CITY supplies 3D planning context; CLARA models urban environmental conditions.
Related applications for development, wind, heat and place design. [57] [58]
Maps and values ecosystem services in terrestrial, freshwater, coastal and urban settings.
A model suite for land-management and conservation analysis. [22]
Simulates crop growth under specified weather, soil and management conditions.
Models agricultural responses to environmental and management changes. [23]
Connects energy, water, land, economy and climate in regional and global scenarios.
A long-running community modeling program. [21]
Finds environmental features in satellite imagery through examples, search and review.
Geospatial representations and foundation models for downstream mapping tasks.
Building blocks used within more specialized applications. [34] [59]
Weather prediction and supporting components, with different distribution and developer options.
Inputs to weather-sensitive operations, risk and planning. [24] [33] [26]
Climate and extremes twins with supporting computing and data workflows.
ECMWF reports operationalization during the program’s second phase. [25]
Models hazards and infrastructure dependencies to examine cascading impacts.
MVP showcased in September 2026; final platform release planned for 2028. [38] [39]
Develops approaches for applying connected data and twins to public and infrastructure questions.
Published cases cover island energy, housing retrofit and emergency planning. [11] [42] [43] [44]
Helsinki publishes city-model data and an energy atlas; Bologna is developing civic twin infrastructure.
Public spatial information, planning and cross-organizational work. [29] [60]
DAFNI supports infrastructure modeling; Wenwen Li’s research addresses GeoAI and geospatial integration.
Contribute data, compute, discovery methods and modeling research. [45] [61] [46]
Explores combinations of climate policies and their modeled effects.
Free browser access and facilitated learning materials. [27]
Organizes spatial proposals, alternatives and stakeholder negotiation.
Supports facilitated planning with maps and associated information. [28]
Coordinate model execution or exchange model information.
Connect simulation components within larger applications. [62] [63]
Represent entities and relationships and connect data within twin applications.
Application infrastructure to which domain models can be attached. [64] [65]
Learns spatial representations for scene reconstruction, generation and robotics simulation.
Adjacent foundation-model work; ecological forecasting remains a separate research challenge. [52] [66]
No matching systems.
Consider a proposal to convert a traffic lane into a cycle lane. The transport model needs the road network, junctions, signal timings, public transport schedules and an estimate of travel demand. A scenario changes the available lanes and routes. The simulation estimates changes in traffic and journey times; other models may calculate emissions or accessibility. An interactive interface lets planners and residents compare proposals.
| Part of the stack | What it contributes in this example | Representative tools or inputs |
|---|---|---|
| Observations and records | Roads, trips, signal timings, counts, population and destinations | Traffic sensors; transport-agency records; census and local GIS data |
| Geographic representation | Aligns roads, parcels, stops and neighborhoods | ArcGIS; infrastructure and city-model platforms |
| Simulation | Represents vehicles, travelers, routes and congestion | Aimsun; MATSim; SUMO |
| Connected models | Relates transport changes to development, emissions or other outcomes | UrbanSim; domain-specific environmental models |
| Experiments | Runs alternatives such as different layouts, demand or travel behavior | Scenario tools and model orchestration |
| Public and professional interfaces | Displays proposed routes, comparisons and shareable results | Browser maps, planning applications and workshop tools |
| Continuing operation | Incorporates new road layouts and observations, and keeps models usable | Data pipelines, hosting and the team responsible for the application |
Connecting transport to housing is a larger undertaking than adding a new visual layer. A transport change may alter where households want to live; development then changes future travel demand. If both effects are represented, the models need to exchange information and reconcile their time steps and geography. FMI and HELICS provide mechanisms for exchanging model information and coordinating simulations. The relationships between the modeled systems still have to be specified. [17] [62] [63]
| Source | Contribution |
|---|---|
| Copernicus Data Space | Satellite observations and Earth-observation processing. [67] |
| USGS Water Data | Stream, groundwater and other water observations. [68] |
| Census APIs | Demographic and socioeconomic datasets. [69] |
| Local and operational records | Parcels, zoning, permits, roads, utility assets, transit schedules and service events |
| Field and community observations | Conditions or changes missing from administrative and remote-sensing data |
| STAC and OGC interfaces | Ways to discover spatial assets and exchange geographic or sensor information. [70] [71] |

| Capability | Example | What the result actually provides |
|---|---|---|
| Inspect a place | Virtual Singapore; Helsinki 3D | A shared spatial representation with associated data and analyses |
| Identify features | Earth Index | Candidate locations of a specified feature in imagery, for review and mapping |
| Anticipate near-term conditions | WeatherNext; Aimsun Live | Weather or traffic estimates for a stated horizon |
| Compare an intervention | Urbanly; PyPSA-Eur; GCAM | Outcomes conditional on modeled policy, technology or behavioral assumptions |
| Coordinate networks | CReDO | Consequences of dependencies between infrastructure systems |
| Explain choices | En-ROADS; Geodesignhub | Ways to explore policies, proposals and trade-offs with other people |
Published evaluations provide more specific examples. Urbanly's housing backcasts use 2011–2014 for calibration and compare 2015–2019 development with recorded outcomes in selected areas of Los Angeles and New York. WeatherNext reports forecasting performance by variable and lead time. Earth Genome's cattle-facility study measures detection performance and explains a practical limit: a second-stage classifier cannot recover facilities the initial search missed. [24] [35] [18] [33]
| Audience | Useful forms of access | Examples |
|---|---|---|
| Corporations and utilities | Operational integration, scenario runs, asset data and planning workflows | Neara; Xylem; DHI; Technosylva |
| Governments | Regional data, cross-agency models, planning interfaces and public explanation | Virtual Singapore; NDTP demonstrators; Helsinki; Aimsun |
| Citizens, educators and civil society | Low-cost access, understandable controls, shareable alternatives and usable data | En-ROADS; Geodesignhub; Earth Index |
| Researchers and model builders | Code, datasets, APIs, compute and reproducible experiments | GAMA; MATSim; SUMO; PyPSA; DAFNI; ASU research |
These audiences overlap. Open code can support expert customization while remaining difficult for a non-programmer to use. A free browser application can reach a wide audience without allowing users to change its underlying model. Public access to a map and public participation in a decision are also different arrangements.
| Term | What it emphasizes | Fit for this survey |
|---|---|---|
| Urban digital twin | A city or urban area | A substantial subset, but excludes many rural, ecological and national questions |
| Territorial or local digital twin | A place and the systems connected to it | A close established umbrella for cross-domain models of regions and communities. [4] |
| Infrastructure or national digital twin | Networks, assets and coordination across organizations | Electricity, water, transport and national programs |
| Cyber-physical-social system | Interactions between digital systems, the physical world and people | Useful when behavior, institutions and policy are explicitly represented. [5] |
| Multiscale digital twin | Connections between different levels of detail | Describes an architecture; it can apply to a machine as well as a region |
| Large-scale or “macro” digital twin | The extent of the system being represented | Readable descriptive language; not a claim to a single standardized product category |
Several traditions contribute to these systems. Engineering simulation supplies physical models and operational practice. System dynamics supplies stocks, flows and feedback; Limits to Growth brought interacting environmental and economic scenarios to a wide audience in 1972. Agent-based modeling represents the decisions and interactions of households, travelers, firms and other actors. GIS supplies the geographic context in which those activities occur. Integrated assessment models such as GCAM connect human and Earth systems. [72] [21] [73] [74]
The participatory side also has a history: Engelbart's work on collective problem-solving, public scenario tools such as En-ROADS, and collaborative planning environments such as Geodesignhub. Today's browser interfaces and AI assistants extend this effort to make complex models usable beyond the team that built them. [27] [28] [75]
Learned environmental representations. AlphaEarth and Prithvi provide reusable geospatial representations or models for tasks such as mapping and classification. Earth Genome shows how these components can be combined with a task-specific workflow. [34] [59] [35]
Nature models as a proposed direction. Ryan Orbuch's Natural General Intelligence essay connects learning environmental dynamics with choosing the next useful observation. Turning that idea into a working ecological application would require evidence that models predict responses to changed management, including conditions outside their training experience. [49]
Spatial world models. World Labs' Atlas combines images, video and 3D information to reconstruct scenes and support simulation. These are useful building blocks for representing places and physical interactions. The gap to a nature model includes biological processes, hydrology, nutrient cycles and long-term responses to intervention; those capabilities are not established by the Atlas demonstrations. World Labs announced its agreement to join AMD on September 28, 2026, with closing expected by year-end subject to approvals and other conditions. [52] [66]
Urban behavior and coupling. Urbanly, UrbanSim and research platforms such as GAMA address interactions among people, development and movement. Work on urban twins by Goodchild, Wenwen Li and colleagues examines how geographic representation, uncertainty and the purpose of a model fit together. [17] [18] [61] [9]
Shared public infrastructure. Destination Earth and DAFNI provide computational and modeling infrastructure. National and territorial programs face the additional task of keeping multiple organizations' data and models connected over time. [25] [46] [44]
Consider a farming watershed where landholders want reliable production and income, healthier soils, less nutrient runoff and connected habitat. The following is an illustrative architecture for exploring that question, assembled from existing modeling capabilities and proposed research directions. It is not a description of a single available product.
| Part of the stack | What it would do in this watershed |
|---|---|
| Shared goals and local knowledge | Farmers, residents, ecologists and public agencies identify desirable outcomes, practical limits, land rights and interventions worth considering. |
| Observations | Combine satellite imagery with weather, stream flow, soil samples, species surveys, management records and field observations. Decide which missing measurements would most affect the choice. |
| Connected models | Link crop growth, soil and nutrient processes, hydrology, habitat and farm economics. DSSAT, InVEST and water-modeling tools cover parts of this problem; learned models could supply additional relationships or faster approximations. [22] [23] [15] |
| Search and experiments | Explore combinations of rotations, planting patterns, water management and restoration across several weather and price scenarios. Use the expensive simulations on the most promising or uncertain alternatives. |
| Human interpretation | Show proposed changes on a map, explain the expected mechanisms and expose disagreements between models. Let participants add alternatives that the search did not suggest. |
| Field learning | Trial selected changes, compare outcomes with expectations and update both the models and the management plan as the landscape changes. |
A useful interface would keep food production, livelihoods, water, biodiversity and net greenhouse-gas balance visible together. A single score can conceal an unacceptable loss: planting trees might increase carbon storage while damaging an existing grassland habitat. Participants need to see the alternatives and decide which trade-offs they will accept.
The search would therefore look for several promising arrangements under explicit constraints. This is multi-objective optimization: identifying options for which improving one objective requires giving up something elsewhere. The frontier changes with the model, the constraints and the conditions considered; a model's preferred arrangement is a candidate for investigation, not a discovered law of land use.
The agriculture evidence supports looking for joint gains, while showing why local testing matters. The diversification synthesis found average improvements in several services, but did not establish a universal climate benefit or a single best farming system. [48] A stewardship twin would help discover where a particular combination works, what sustains it and how neighboring places are affected.
A street can move cars efficiently while being difficult to cross on foot. A landscape can contain suitable habitat while separating the animals that need it. Here, sensory landscape brings together sound, light, smell and the barriers that shape how people and other animals inhabit a place. It is a proposed direction for connected twins, drawing on existing work in sensory ecology, access and habitat connectivity.
Some pieces already exist. Walk Score measures walkability; Circuitscape models landscape connectivity, including wildlife corridors. Noise, lighting and dispersion engines can estimate conditions at particular locations. Connecting these to species-specific responses and human experience could let a planning team compare a road crossing, a quieter flight route, a dark corridor or a different lighting schedule.
The consequences can extend beyond immediate discomfort. Boyes and colleagues found fewer moth caterpillars beside lit hedgerows and grass margins than at matched unlit sites. Van Doren and colleagues observed a high-intensity light installation disrupting migrating birds. Serrano and Ochoa-Ochoa documented aircraft noise changing Pedregal frog calls and reducing chorus activity.
Bernie Krause’s account of a jet disrupting a frog chorus goes further: breaking the collective sound exposes individual callers to predators. That account is a useful illustration of a possible chain of effects; the Pedregal study measured vocal behavior, not increased predation. A coupled twin would need to test each link: disturbance, perception, behavior and ecological outcome.
Sources reviewed in September 2026. Project dates distinguish operational systems, demonstrators and research proposals.
Each domain has a distinct pastel color, carried by its pictogram, application labels and diagram connections. Dark text keeps every label readable.
Icons have been recolored; their original shapes are retained. View the candidate symbols, colors and reusable vocabulary.
